Grafana vs Datadog: Choosing an Observability Operating Model

Content authorBy Irina BaghdyanPublished onReading time19 min read
Abstract digital infrastructure with connected data blocks representing a document management system and automated workflow

The real question comes down to which observability operating model fits your engineering capacity, architecture, reliability requirements, and telemetry economics. Here's how self-managed Grafana, Grafana Cloud, and Datadog compare on architecture and three-year cost, plus a repeatable scoring model for your own telemetry volumes and staffing, and a proof-of-concept structure to test the shortlist before you commit.

Grafana vs Datadog scope

The Grafana vs Datadog decision is framed as open source against commercial software, which is the wrong frame. Both options cost money. Both require ownership. What differs is where the cost lands and who absorbs the risk when the observability layer itself fails.

One clarification first. Grafana, the visualization layer, sits inside a full observability pipeline. Comparison pits Datadog against that pipeline, whether you run those components yourself or buy them as Grafana Cloud.

That framing understates the real choice. There are three operating models, not two:

ModelWho operates the backend?Main trade-off
Self-managed Grafana stackYour team or MSPControl vs. operational complexity
Grafana CloudGrafana LabsOpen ecosystem with managed operations
DatadogDatadogIntegrated managed platform

Most of the analysis below still resolves into self-managed-vs-Datadog trade-offs, since that's where the architectural and cost differences are sharpest. Grafana Cloud sits between the two, and a fourth option exists for teams that want the open stack without owning it: self-managed observability operated by an external DevOps/MSP team.

Five criteria carry the decision here. Architectural fit and reliability ownership sit alongside governance and data control. Workload characteristics and three-year economics with internal labor complete the list. Teams screening Datadog alternatives weight three-year economics over reliability ownership.

Architecture and ownership

Datadog presents an integrated managed observability platform, supporting multiple telemetry collection models (including its own Agent and OpenTelemetry). A Grafana-centered stack is a set of components you assemble, each with its own scaling behavior and failure mode. That structural difference drives cost and almost everything else in this comparison.

Ownership is the dividing line. With Datadog, the vendor owns uptime and capacity planning for the telemetry backend. With a self-managed stack, your platform team owns all of it, and that work does not disappear during a quarter when the roadmap is full.

Portability cuts the other way, with a caveat. Instrumentation written against OpenTelemetry moves between backends. But dashboards, queries, alerts, SLO definitions, and operational workflows are largely backend-specific, and rebuilding them is real migration cost. OpenTelemetry materially reduces instrumentation lock-in; it doesn't make the rest of your observability layer portable.

OpenTelemetry changes the Grafana vs Datadog decision

OpenTelemetry graduated as a CNCF project in May 2026, cementing it as the vendor-neutral standard for collecting and processing telemetry. That matters more to this decision than either backend's feature list.

Instrument once with OpenTelemetry, then treat the backend as a replaceable architectural decision wherever practical. Grafana Labs' 2026 survey found 65% of respondents now invest in both Prometheus and OpenTelemetry, with OTel used for metrics by 57%, traces by 50%, and logs by 48% of respondents. Thirty-seven percent cite easier switching between vendors as an expected benefit.

The caveat carries real weight, though: collection portability is much stronger than operational portability. Dashboards, alerts, SLOs, retained data, proprietary analytics, and incident workflows can still create backend dependence even when the telemetry itself is vendor-neutral.

Grafana monitoring stack

A production Grafana monitoring setup combines Grafana for query and visualization with Prometheus or Mimir for metrics. Loki and Tempo cover logs and traces, and collection runs through OpenTelemetry Collector. Each piece is independently scalable, which is the point, and independently operable, which is the cost.

Scalability is not a constraint here; operating that scale economically and reliably usually is. Grafana Labs load-tested Mimir with a single tenant at 1 billion active series on a cluster of 1,500 replicas across roughly 7,000 CPU cores and 30 TiB of RAM. That scale requires deliberate architecture, and the follow-on releases have kept changing the operational picture. Mimir 3.0 reworked the ingest path to reduce read-path outage probability during ingester failures.

Raj Dutt, co-founder and CEO of Grafana Labs, describes the design philosophy plainly: "Our big tent philosophy is about allowing our customers to own their observability journey, make their own choices, choose their own vendors, choose their own technologies." That's an accurate description of both the benefit and the obligation.

Datadog managed platform

Datadog collects through a single agent and correlates signals inside one platform. The integration surface is wide, with the company citing more than 1,000 out-of-the-box integrations for cloud services and legacy systems, plus security tooling. Time to first useful dashboard is measured in hours.

The tradeoffs are real and worth naming. Instrumentation follows Datadog's model, telemetry lives in Datadog's storage, and your cost structure is set by their meters. Metrics sent through OpenTelemetry are billed as custom metrics. OpenTelemetry improves portability, but it doesn't make backend economics portable: once telemetry reaches Datadog, it's still subject to Datadog's applicable product and billing dimensions, so teams should test real OTLP volumes during a proof of concept rather than assume a rate.

Vendor management also means vendor dependence during incidents. On March 8, 2023, Datadog lost five regions at once. As Alexis Lê-Quôc, Datadog's co-founder and CTO, wrote in the public report, users could not access the platform via browser or API, "and monitors were unavailable and not alerting."

Core capabilities compared

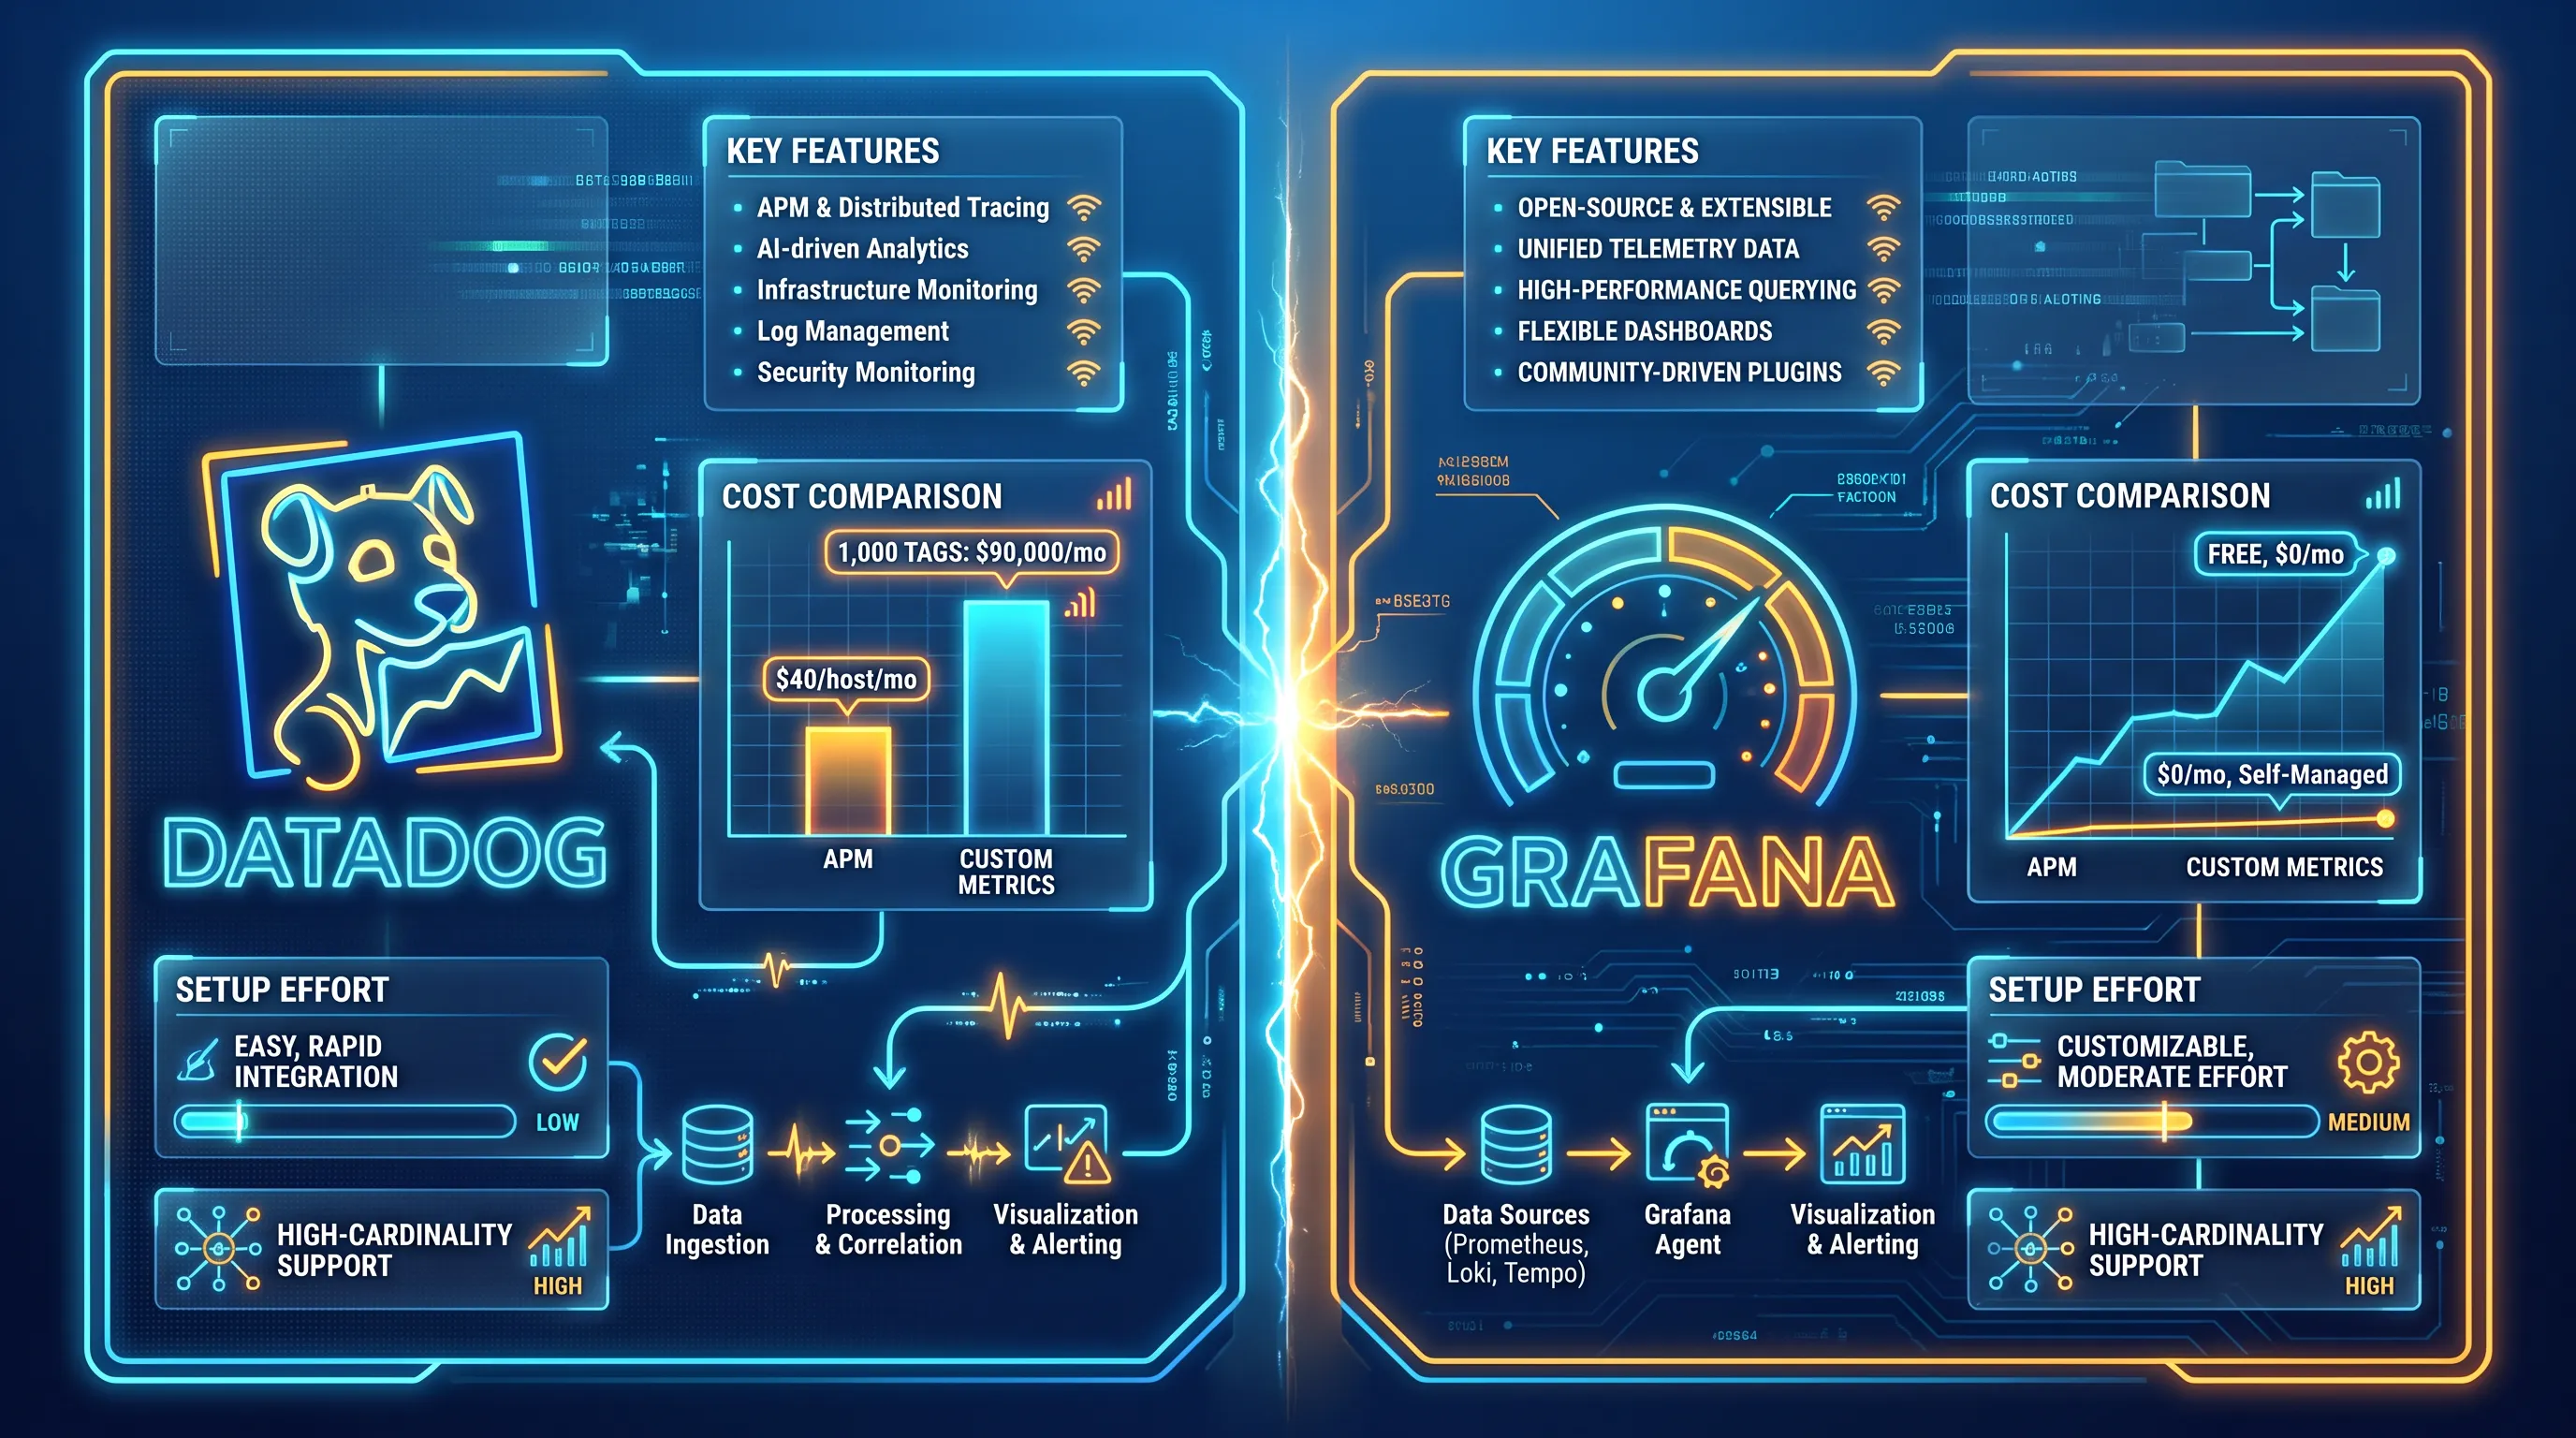
A neon-themed infographic comparing Grafana and Datadog for telemetry, featuring icons, charts, and key metrics on a blue gradient background.

Feature checklists flatter Datadog because the platform has more named products. A more useful test is how fast an engineer moves from alert to root cause at 3 a.m., and how much configuration work stands between you and that outcome.

Both options can answer the same questions about a distributed system. The difference in grafana vs datadog is how much assembly the answer requires. Datadog correlates signals by default. A composable stack correlates signals once you've standardized labels, trace IDs, and exemplars across services.

Telemetry architecture: the Collector as control plane

"OpenTelemetry Collector collects telemetry" understates what it actually does. For a real architecture, the Collector sits between applications and any backend, and it's where the real engineering decisions live:

  • Filtering: drop what you don't need before it's billed or stored

  • Enrichment: attach service, environment, and ownership metadata

  • Sampling: control trace and log volume without losing signal

  • Redaction: strip sensitive fields before telemetry leaves your boundary

  • Batching: control export efficiency and backend load

  • Routing: send different signals, or the same signal at different fidelity, to different backends (Datadog, Grafana, or both)

Treated this way, the Collector is a telemetry control plane, not a pass-through agent, and it's the layer that makes a multi-backend or migration-ready architecture practical rather than theoretical.

Need IT Support?

Book a free consultation with ABS Technologies experts we'll help you find the right managed IT, cloud, or security solution for your business.

Book a Free Consultation →

Telemetry and APM

Datadog's application performance monitoring (APM) is deeper out of the box, with service maps and span-level search wired into the same interface as infrastructure metrics. That depth shows in pricing too: Datadog itself currently lists APM Enterprise starting at $40 per host/month, with the Continuous Profiler included.

A Grafana monitoring stack reaches comparable coverage through Tempo for traces and Pyroscope for profiles, with PromQL and LogQL as the query languages. The querying is powerful, and the components are proven, but correlation across signals depends on instrumentation discipline that your team enforces.

High-cardinality telemetry is where the two diverge most sharply. Prometheus-style storage charges you in memory and infrastructure as series counts grow. Datadog charges you in dollars, because one metric name multiplied across tag values can produce thousands of billable time series, and a single customer_id tag across 1,000 customers can generate 90,000 custom metrics.

The three pillars (metrics, logs, and traces) are increasingly becoming four signals. In March 2026, OpenTelemetry Profiles entered public Alpha, moving continuous profiling toward the same vendor-neutral telemetry model as the rest of the stack. For teams already weighing Pyroscope against Datadog's Continuous Profiler, that's worth tracking: profiling data giving code-level CPU, memory, and execution visibility connects performance directly to infrastructure efficiency, cloud cost, and code-level optimization.

Integrations and alerting

Integration favors Datadog, and that matters most when your estate includes managed cloud services and network devices, along with legacy systems nobody wants to instrument by hand. Anomaly detection and forecast monitors arrive configured, as do Watchdog insights.

Alerting in a Grafana monitoring stack is capable and consistent once defined as code, which appeals to teams that already manage infrastructure through Terraform. The catch is the work between "capable" and "configured." Grafana Labs' fourth annual survey of 1,363 engineers across 76 countries found complexity and overhead are now the biggest observability concern.

Alert quality is a separate problem that neither vendor solves for you. Alert quality is a separate problem that neither vendor solves for you. In the 2025 edition of the same research, alert fatigue ranked as the number one obstacle to faster incident response at nearly every level of an organization. Fixing it takes a defined operating model, not a tool switch: service ownership, severity definitions, escalation paths, SLO/burn-rate alerts, runbooks, deduplication, maintenance windows, routing, and post-incident tuning. Grafana's 2026 survey still puts alert fatigue at the top of the list, which means observability implementation isn't complete until every actionable alert has an owner, an escalation path, and a response procedure. That's independent of which platform sits underneath it.

Retention and access

Retention is where commercial and operational consequences meet. Datadog logs bill on ingestion plus indexing, and extending retention beyond the default tiers adds cost per indexed event, which is why most teams end up indexing a fraction of what they collect and losing visibility into the rest.

Grafana Cloud charges for log processing, ingestion, and retention separately, so costs scale with both volume and how long you keep data. Self-managed Loki instead puts long-term storage on object storage you already pay for, which changes retention from a pricing negotiation into a capacity decision.

Portability deserves attention before you sign. Owning the underlying object storage improves data control and can simplify some migration scenarios, but storage custody alone doesn't guarantee another backend can directly consume the existing data format. Verify format compatibility with any specific target before counting on it.

Teams that keep a shortlist of Datadog alternatives current are protecting their negotiating position as much as their architecture.

AI-assisted operations

Both platforms are building AI into the operator's workflow rather than just the dashboard. Grafana's 2026 survey found 92% of respondents see value in AI surfacing anomalies before downtime, and 91% see value in AI-assisted root-cause analysis and forecasting, though users remain notably more cautious about autonomous remediation. Grafana now offers Assistant and investigation tooling; Datadog positions Watchdog around the same anomaly-detection and automated-RCA ground.

The comparison that matters isn't which platform's AI is better. It's this: AI-assisted operations sit above the telemetry layer, and their usefulness depends entirely on the quality, consistency, and context of the telemetry underneath them. A platform choice that produces noisy, poorly labeled telemetry will produce noisy AI output regardless of vendor.

Emerging workload: AI and agent observability

This is a different question from AI helping operators and focuses more on whether the platform can observe AI workloads themselves: LLM request volume, model latency, token use, model/provider cost, agent tool calls, vector database performance, GPU utilization, output quality, and prompt/evaluation metrics.

Grafana's 2026 survey found 57% of respondents have LLM observability somewhere between investigation and production, and Grafana Cloud now explicitly supports AI/agent observability around token usage, cost, quality, tool calls, and model behavior.

The point isn't to sell AI observability for its own sake. It's that before committing to a platform for the next three years, it's worth verifying it covers the workload types you're likely to operate over that horizon — not only today's VM and Kubernetes estate.

Operations and governance

Every observability platform has an operator. The only question is whether that operator is on your payroll. A self-managed stack means your team owns version upgrades and capacity planning for ingesters and queriers. The same team also owns backup and restore procedures and availability targets for the system that tells you whether everything else is available.

Governance pulls in the opposite direction from operations, and this is where Grafana vs. Datadog gets genuinely difficult. Datadog holds FedRAMP authorization and SOC 2 Type II. It also holds ISO 27001 and offers HIPAA-compliant log management. Self-hosting gives you control over residency and isolation but transfers the entire evidence burden to your compliance function.

Skill requirements differ in kind. Running a Grafana monitoring platform at scale needs people who understand time-series storage internals, and that expertise is expensive.

The continuing workload is the item most cost models omit. Budget for these as recurring commitments:

  • Component upgrades and compatibility testing across metrics, logs, and trace backends

  • Capacity planning tied to cardinality growth, not just host count

  • Access control, audit logging, and tenant isolation as teams multiply

  • On-call coverage for the observability platform itself, including runbooks for querying when the query layer is degraded

A self-managed stack can also be supported through managed IT services when internal teams need additional operational coverage.

What managed observability should include

Whichever operating model you land on, the recurring work described above has to sit somewhere. If it's outsourced, here's what "managed" should actually cover:

ResponsibilityOutcome
ArchitectureAppropriate stack and backend selection
OTel rolloutStandard instrumentation across services
Collector managementReliable telemetry pipeline
Dashboard standardsConsistent service visibility
SLO designBusiness and reliability focus
Alert engineeringLower noise
Cost governanceControlled telemetry spend
Capacity planningPredictable scaling
Platform upgradesReduced operational burden
Incident supportObservability platform stays usable during incidents
Access / RBACGovernance
IaC / GitOpsReproducible configuration
Monthly optimizationOngoing telemetry and cost tuning

Need IT Support?

Book a free consultation with ABS Technologies experts we'll help you find the right managed IT, cloud, or security solution for your business.

Book a Free Consultation →

Grafana vs Datadog costs

List prices are a starting point that almost nobody actually pays, so model drivers instead of rate cards. Datadog bills on hosts and containers beyond the per-host allotment. Custom metrics by time series and log ingestion and indexing add further cost, as do indexed spans and retention extensions. Volume commitments and negotiated rates move all of it.

Custom metrics are the meter that surprises people. Datadog charges per indexed custom metric above an allocation, with the actual overage threshold set in your contract and explained in Datadog's custom metrics billing docs. One platform team found that its cloud provider integration was auto-appending unused metadata tags, accounting for a substantial share of total custom metric volume, according to Groundcover's analysis.

Grafana Cloud bills on active series and gigabytes of logs and traces. Host hours for some products and active users also factor in, with metrics priced per billable series on the Pro tier, per Grafana's own current pricing documentation. Self-managed shifts spend to compute and object storage. The pattern across Datadog alternatives is the same: you trade a predictable vendor invoice for infrastructure you size and staff yourself.

Scale changes the shape of the answer, and migration itself is not free. One well-documented case: a company's Datadog bill grew large enough, as revenue contracted, that it stood up a dedicated team to evaluate moving to Grafana, Prometheus, and ClickHouse, then stayed on Datadog after renegotiating. Read that as a migration-cost case study rather than a verdict on Datadog's economics generally: large observability migrations require their own engineering teams, dual-running, and operational risk. Avoiding lock-in only pays off if the cost of preserving portability is lower than the switching cost you'd actually incur.

For a broader framework for evaluating cloud cost, include observability spend alongside the infrastructure it depends on.

Telemetry cost governance

The cost question isn't only "which vendor is cheaper." Increasingly it's "which telemetry should we be collecting at all." Grafana's 2026 survey puts cost as the top tool-selection criterion at 65%, but complexity is now the largest operational concern overall, which is a stronger argument for deliberate telemetry governance than simply pointing at Datadog's bill.

Practical governance habits: track custom metric (or billable series) count as a share of total spend, review tag cardinality additions in code review rather than after the invoice arrives, and set usage alerts ahead of the renewal conversation — not after a surprise bill.

Three-year TCO model

Build the model on measured telemetry, not estimates from a vendor calculator. Pull your actual active series count and daily log volume in gigabytes from what you run today, along with trace volume and host and container counts. Then separate cost pools for vendor or infrastructure spend and internal labor, and keep risk as its own pool.

Risk is the pool teams skip, and it belongs in Grafana vs Datadog analysis because both paths carry it. For the managed platform, price the exposure of a provider outage against your revenue per hour. For the self-managed stack, price the delay in incident detection when your own backend is the thing that broke.

Use a multi-year horizon aligned with your actual contract term and platform lifecycle. Three years is a useful default scenario, not a universal rule. A one-year view tends to flatter the managed option; a longer view tends to flatter the self-managed one past the point of reliable prediction. Model your committed term, then stress-test one horizon shorter and one longer.

Baseline cost inputs

Collect these before modeling anything, and collect them from telemetry:

  1. Current host count, container count, and peak-versus-average ratio, since Datadog bills infrastructure on a high-water mark

  2. Active metric series and the tags driving cardinality, measured per service

  3. Daily log and trace volume in gigabytes, split by what you index versus archive

  4. Retention tiers required by policy, contract, or regulation

  5. Named users needing query and dashboard access

  6. Fully loaded engineering compensation for the platform team, plus expected support tier cost

  7. One-time migration cost, including dual-running both stacks during cutover

A Grafana monitoring build adds one input that Datadog does not: headcount. Decide whether that's a fraction of an existing platform team or a dedicated hire, and model both.

Scenario and sensitivity tests

Run expected growth across three years, then stress each model independently with low and high cases. Cardinality growth of 3x with flat host count breaks Datadog budgets faster than host growth does. Log volume growth breaks Grafana Cloud budgets first.

Test staffing separately from volume. A self-managed stack that pencils out with two dedicated engineers looks different if one leaves and hiring takes five months. Test the discount assumption too, because negotiated rates hold only until usage moves outside the committed band.

Include outages in both directions. Datadog's March 2023 incident took roughly 13 hours of engineering work to restore compute capacity across affected regions, and the company has since built a secondary-site product specifically because single-cloud reliance creates blind spots during incidents. Model what a comparable blackout costs you under each option.

Workload fit

Recommendations only hold conditionally, and the condition that matters most is capacity. A team with two platform engineers and an aggressive product roadmap will get worse observability from the more flexible option, because the flexibility goes unused.

The market for Datadog alternatives is splitting. Half of respondents in Grafana Labs' latest survey now use SaaS for observability in some capacity, with the SaaS-only share growing from 10% in 2024 to 17% in 2026. Cost remains the top tool selection criterion at 65%, which explains why Datadog alternatives keep appearing on evaluation shortlists even at organizations happy with the product.

Kubernetes environments

Container churn is the economic variable. Pods that live for minutes generate label cardinality continuously, and per-container billing plus per-timeseries billing compound in ways that flat host counts never show. This is where modeling produces a surprise.

OpenTelemetry alignment favors the open stack here, since OTel is now in broad use across metrics at 57% adoption and traces at 50%, with practitioners citing freedom to switch vendors at 37% as a top reason for adoption. Sending that same OTel data into Datadog puts it in the custom metrics bucket.

There's no universal node count where the answer flips. A 20-node environment with heavy trace and log volume can cost more than a 500-node, lightly instrumented one. The variables that actually decide it are nodes, containers, series cardinality, logs, traces, profiles, retention, query load, staffing, and discount structure. Kubernetes size alone shouldn't determine the platform; measure telemetry density and churn per workload instead of relying on node count as a proxy.

SaaS product teams

If your engineers ship product, buy the platform. Datadog's integrated APM and prebuilt developer workflows remove weeks of setup, and the ownership boundary is clear enough that nobody on your team carries a pager for the monitoring backend.

The counterargument arrives with scale, and it arrives fast during growth. Coinbase's own engineering account describes its Datadog costs climbing before the company built a dedicated team to evaluate alternatives when the market turned. The lesson is that large-scale telemetry spend needs active monitoring before it becomes a crisis, whichever platform you're on. Instrument with OpenTelemetry from day one so that decision stays cheap.

Build a cost governance habit early. Track custom metric count as a percentage of total spend and review tag additions in code review. Set usage alerts before the renewal conversation.

Regulated workloads

Data residency changes the math entirely. Saudi Arabia's Personal Data Protection Law (PDPL) restricts transferring the personal data of residents outside the Kingdom, and the Saudi Data and Artificial Intelligence Authority (SDAIA) now enforces cross-border transfer rules requiring sensitive and personally identifiable data to stay in-country absent a specific exemption.

Telemetry contains personal data, because request logs carry user identifiers and trace attributes carry customer context. If your logs are in scope, a self-hosted Grafana monitoring deployment inside the required jurisdiction answers residency directly, at the cost of producing your own audit evidence.

Where the regulator accepts a vendor with established assurance, the managed path is faster. Datadog operates within a FedRAMP High boundary for government workloads and publishes control mappings for internal authorization processes, which removes documentation work from your compliance team.

Decide with a proof

Score the five criteria with weights your leadership agrees on, then test the top two options on one real service for 30 days. Measure time to first dashboard and time from alert to root cause. Capture actual billed usage at production volume. Assumptions fail in proof of concept, which is the cheapest place for them to fail.

ABS Technologies can assess your current observability estate, telemetry volumes, incident workflows, and platform capacity, then design a target architecture around OpenTelemetry, SLOs, and cost governance. The assessment compares managed platforms such as Datadog and Grafana Cloud against self-managed open-source architectures, and defines the migration path and operating model for whichever fits. Talk to our team.

Need IT Support?

Book a free consultation with ABS Technologies experts we'll help you find the right managed IT, cloud, or security solution for your business.

Book a Free Consultation →

Measure labor as recurring engineering time, not only initial setup hours. Include upgrades, capacity reviews, access changes, incident response, and backup testing, then multiply the hours by fully loaded compensation. Add a separate replacement scenario that assumes an engineer leaves, since hiring delays can change the self-managed option’s result.

Set controls for personal data, retention, tag creation, and access before production traffic reaches the platform. Remove unnecessary identifiers, restrict high-cardinality fields such as customer IDs, and define who can query sensitive logs. These rules reduce cost and limit the impact of an accidental data disclosure.

Yes, running both platforms during a defined migration window can validate coverage and compare real usage. Send the same selected service telemetry to each system, compare alert-to-root-cause time, and record duplicate ingestion costs. Set an end date for dual operation so temporary migration spend doesn't become the permanent design.

A small team should choose Datadog when it lacks capacity to operate a monitoring backend and needs integrated APM quickly. The managed option can remove work from the platform team, although usage-based charges still require controls. Self-managed Grafana fits better when the team can support on-call duties and values storage control.

ABS Technologies can help structure the comparison around telemetry, staffing, governance, and three-year cost. An outside review can challenge volume assumptions and define a focused proof of concept. If you need that assessment, contact ABS Technologies through its contact page and provide your current telemetry and operating constraints.

Schedule a Meeting

Book a time that works best for you and let's discuss your project needs.

You Might Also Like

Discover more insights and articles

Industrial automation control system with connected electrical components and data infrastructure

Software Supply Chain Security: Controls That Protect Code from Commit to Production

Every step between a developer's commit and a running production workload is a place an attacker can intervene: a poisoned dependency, a tampered build, a stolen pipeline credential, an unsigned image. Mapping these attack paths end to end shows which control interrupts each one and where a single control covers several paths at once. Because funding every control at once is rarely possible, a ranking method then orders the work by the risk each control removes, so limited budgets go first to the gaps attackers are most likely to use.

Business team viewing a digital technology network and interconnected data systems in a modern corporate environment

GitHub Actions Self-Hosted Runners: Secure Architecture and Autoscaling Patterns

Self-hosted GitHub Actions runners give teams control over cost and environment, but they also put build infrastructure inside the trust boundary, where a single compromised workflow can reach internal systems. A defensible architecture starts by naming the threats runners introduce, then applies controls that contain them: ephemeral runners, default-deny network isolation, and short-lived workload identity in place of stored cloud credentials. Scaling models sized to real demand keep capacity honest rather than padded. A cost model and a migration path off persistent runners complete the case, laid out so engineering and finance can review and approve it in a single meeting.

Futuristic digital system with connected components and data flows representing document workflow automation

HashiCorp Vault Secrets Management: Architecture, Adoption, and Operational Reality

The real shift in secrets management comes from long-lived, standing credentials to workload identity that issues short-lived ones on demand. HashiCorp Vault secrets management is one route to that shift, but it fits only some environments. This guide lays out the difference: where Vault earns its operational cost, when a simpler managed store is the better call, and how to sequence adoption without a disruptive cutover.

Title:
Containers and Orchestration: The Future of Scalable Apps

Meta description:
Read: How are containers redefining scalability? You learn to deploy code faster and cut server costs.

Article:
# C

Containers and Orchestration: The Future of Scalable Apps

Most teams adopt containers expecting speed and simplicity. What they get is Kubernetes in production. The DORA research is direct about what happens next: migrating workloads to flexible cloud infrastructure without changing how you operate them can be more harmful than staying in a traditional data center. This article is an operational guide to what happens after adoption.